
Understanding Squarespace Analytics to Make Data-Driven Decisions

Even if you’re just starting out with the Squarespace platform, it’s important to have a grasp of what the analytical data is telling you. Whether your website has just launched or your established site has thousands of views per month, Squarespace analytics is a valuable tool you’ll want to maximize.
In this guide, our goal is to help you gain a basic understanding of Squarespace analytics, including what it is, how it can serve you, and what it’s telling you about your site and your SEO efforts.
Some of the main takeaway points we’ll cover include:
How to read and decipher Squarespace Analytics
Understanding the terminology
Making the most of keywords
How data tells a story you can learn from
What to focus on depending on the type of site you run, such as ecommerce, portfolio, blog, or other
How to optimize your site to grow and scale your business
Understanding this tool and knowing how to use it will help you make the necessary changes that will drive more targeted traffic to your site. Let’s get started. There is a video below plus an article.
Table of Contents in Detail Hide
Understanding Your Squarespace Analytics Terminology

Image Source: Unsplash
To make sure everyone’s on the same page, we’ll first go over commonly used terms and explain what they mean.
Bounce Rate
If I go to a page on your website but I leave your site without visiting any other pages, that is an instance of a bounce. I’ve bounced into your site and back out without browsing through your other pages. This type of visit counts towards your bounce rate.
The bounce rate reflects all the times when visitors go to your site and leave without looking at any of your other pages.
A high bounce rate can be either good or bad, depending on the type of site you run. For example, if you’re a blogger you’ll want a low bounce rate. Too high a bounce rate means that someone went to your site but did not find what they were looking for, and consequently left.
If you’re a consultant, though, a high bounce rate could be good. It might indicate that people are finding your site, landing on a page, and seeing exactly what they’re looking for, prompting them to fill out a form and make a booking with you.
So the bounce rate by itself means little; you need to weigh it against what you’re trying to achieve with your site, and whether that goal is being accomplished.
Conversion Rate
The easiest was to think about what a conversion means is that somebody has taken action on your website.
In the past, websites were big on information. Today, they’re more directional; this means that you need to give people a focus on what to do on your website. Of course, they have full autonomy to do what they want, but a conversion is a way to track specific actions taken.
What exactly are you tracking? Again, it depends on your site and what you’re offering. Ecommerce sites track sales. Consultants track people filling out a form or scheduling a meeting. Sites offering services or entertainment track appointments or reservations being made.
Within Squarespace, you have a few options in terms of what factors into your site’s conversion rate. They include:
Sales by product
Sales in general
Form submissions
Button submissions
Third-party tools like Google Analytics can give you additional conversion tracking options.
As an example of what a conversion rate might look like, let’s say one hundred people land on your site. Three of them fill out a form. This would give you a 3% conversion rate, since three out of a hundred is 3%.
Direct Traffic
Your Squarespace site can get traffic in different ways. Traffic can come from:
An organic search, such as someone typing a search term on Google and finding your site listed
People being directed to your site from social media platforms
Visitors going to your site by clicking on ads
Somebody going to their browser and typing your URL specifically to go to your site; this is considered direct traffic
Even though there are many ways to get traffic to your Squarespace site, direct traffic comes from people typing your website’s URL directly in their browser.
Unique Views & Unique Visitors
The word “unique” separates what is being described from different types of data.
Let’s say I go to your website today and look at ten different pages. I return to your website tomorrow and look at ten pages. I go to your site a third day and view ten pages. During those three days, you’ve received 30 page views. However, all those views came from just one unique visitor.
The number of unique visitors, then, is an estimate of the total number of actual visitors who reach your site within a set time frame. You may have 10,000 page views but only 4,000 actual visitors.
It’s common for page views to be considerably higher than number of visitors.
What to Look for From the Data

By understanding Squarespace analytics terminology, you can make better sense of the lists, graphs, and charts you see. But what do you do with the data? Where should you focus your attention?
We’ll start with traffic and look at device preference and browser preference.
Top Devices & Browsers
Squarespace analytics will tell you the top-used devices and browsers for accessing your site. This information is important because you’ll want to ensure your design is amazing for your visitors’ user experience. Your site has to work well across all devices and be optimized for all browsers, but you’ll need to put extra care into creating a superlative experience on the device people use the most to access your site.
Is most of your traffic coming from desktop or mobile devices? Which browser do most people use to search for your site?
If most of your traffic, for example, is coming from desktop, and most people are using Chrome to find your site, you want to make sure that you design your site for an amazing user experience on laptops and other computers.
If most people are viewing your site on a mobile device, such as their smart phone, then you’ll want to make sure to provide an exceptional user experience on Safari and Chrome, as well as on social media.
Use your website the way your visitors are using it.
If most of your visitors access via their phones, make sure the buttons appear where they need to be and aren’t forced off the screen. Design and troubleshoot first for the top devices and browsers and then for everything else.
To summarize:
Check which devices and browsers people are using most to access your site
When designing your site, create an amazing user experience for these devices and browsers
Test, check, and troubleshoot your site on the top devices and browsers to see what most of your visitors are seeing
Fix anything that’s broken or missing
Your site may look great on desktop but as soon as you switch to mobile, perhaps you’ll see that important elements are gone. A poor user experience will drive visitors away. To get people to stay and take action on your site, create a strong user experience across different devices.
Growth: Where Does it Come From?
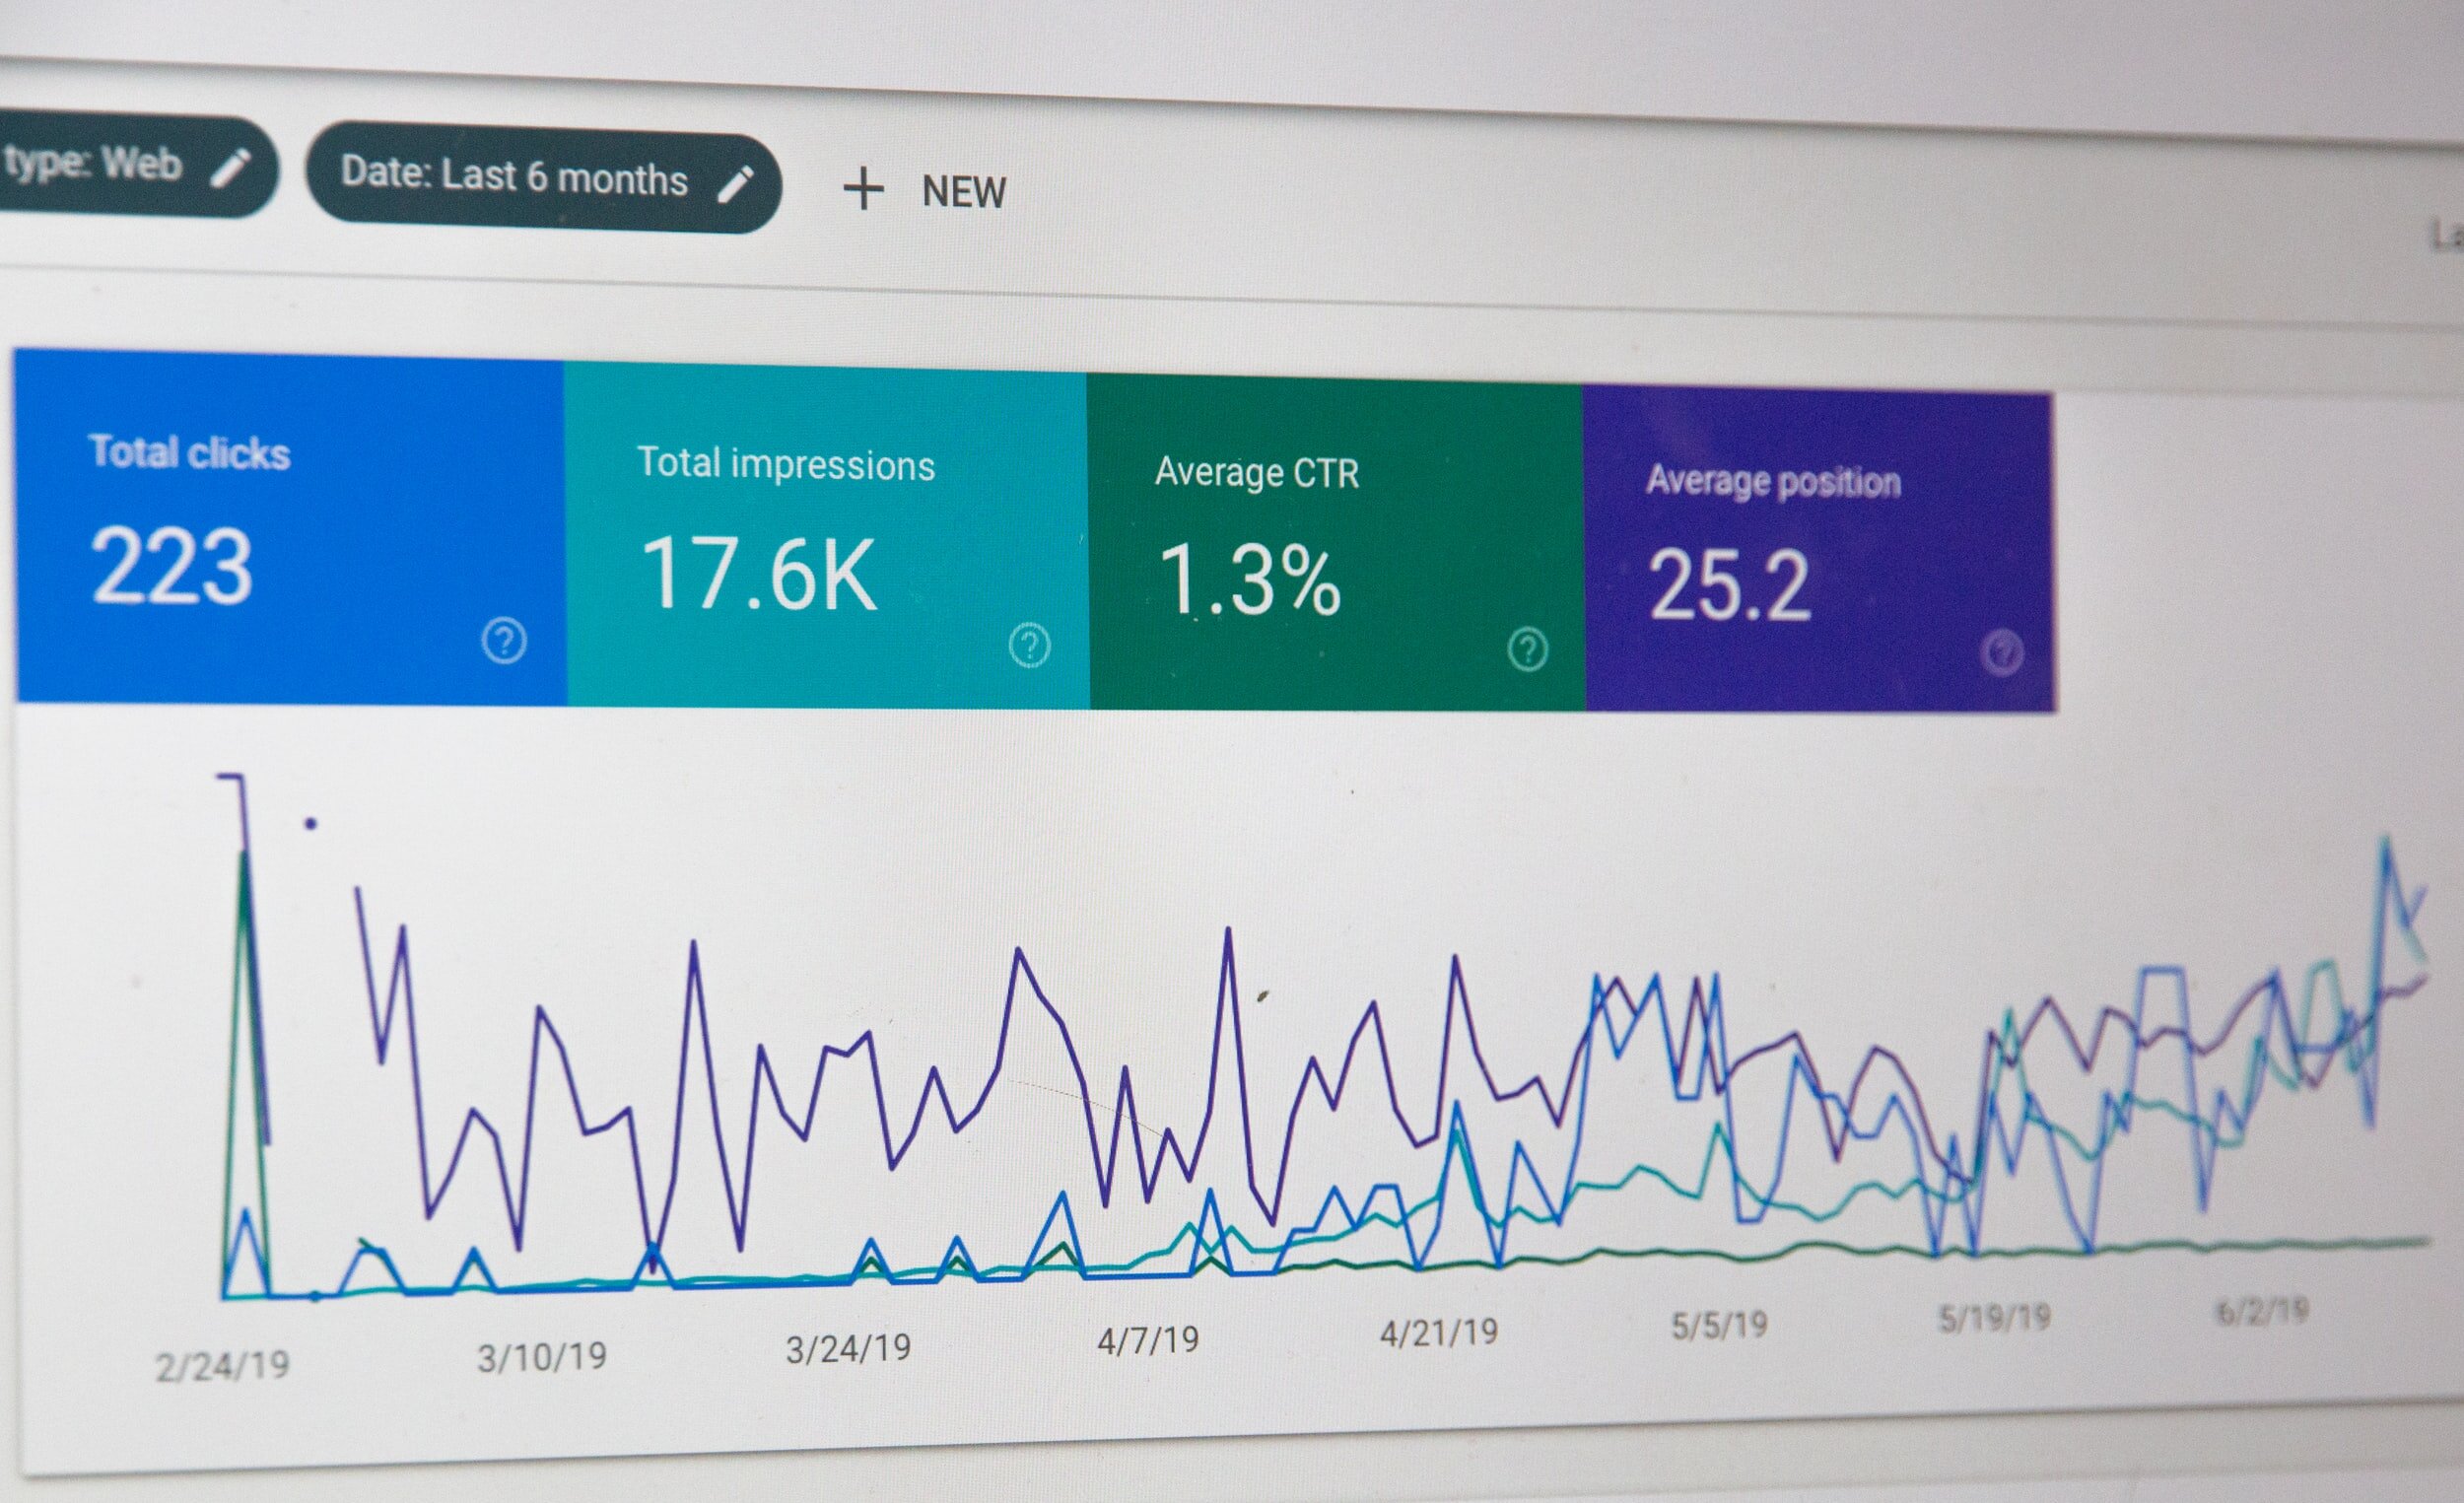
Image Source: Unsplash
In your Squarespace analytics, check your traffic sources over a period of time, such as year-to-date. As you look at this data, ask yourself: Where have we grown the most?
The graphs will show your site’s growth from:
All sources
Direct traffic
Searches
And other options
You can select which sources you want to check, adding and deleting items on the graph as needed.
These graphs allow you to see where growth is happening at the moment. If it’s coming from direct traffic and search, that’s awesome. Where might you want to optimize next? The next optimization area to focus on might be SEO. If your paid social media is working well, perhaps focus more on that. Or maybe email campaigns are doing well; why not expand there?
These graphs provide you with information you need to see what’s working, what isn’t, and where you can focus next to generate better growth.
You can also use this information to look for less-performing areas to cut out of your marketing strategies. For example, if you’re putting a lot of effort into email campaigns but they aren’t bringing results, stop your campaigns and allocate your resources elsewhere.
Or say you’re doing paid ads. The analytics clearly show how many visitors you had, how much revenue these visits produced, what the conversion rates were, and how many orders came in. If you’re spending a lot of money on paid ads but the analytics show that they’re not giving you good results, you can decide if you need to cut or change your ads.
By paying attention to the analytics, you’ll see where growth is coming from, and you can make informed decisions to market better to your intended audience.
Site Content
It’s also helpful to look at data in one-month chunks. Taking a look at growth and performance over the last 30 days, you can determine what’s especially valuable to the user. The Squarespace analytics will reveal to you the top five or six pages that most people are spending their time on.
With this information, you can now optimize those pages that your visitors are accessing the most. Perhaps people are visiting your About page, but you haven’t put much work into it, or it’s not even on your navigation. Now that you know from the data that a lot of people are ending up on your About page, you can focus on the content on this page to add in information you want to make sure your visitors see. Also make sure About is listed on your navigation bar.
You can even choose to rearrange your menus so that the five or six pages with the most visits go on your main navigation, and the remaining pages are placed down in the footer.
Squarespace analytics help you understand where people are finding value in your site. With this information, you can update your content to get additional value in front of them via the pages they’re already visiting.
The data for site content allows you to:
Know which pages your users are visiting the most
Work on making these pages as easy to access as possible
Add even greater value to the pages being visited
Examine why some of your conversion goals aren’t happening
Optimize your site to include more products or services on the pages being visited
If you discover that certain pages are getting a lot of visits but are not converting for you, then make sure these pages have a clear call to action.
If many people are visiting a page but the bounce rate is high, add in a clear call to action to encourage conversions.
Overall Search Performance

Image Source: Unsplash
You can easily set this up with Google Search Console and your Gmail account. Once this is set up, you can start pulling relevant data, and you’ll want to focus on two areas.
One is this: Which keywords are bringing in a lot of traffic?
And the second: What keywords do you want to bring you a lot of traffic that aren’t doing so?
Answers to these questions are especially useful for bloggers and content creators.
Near the top of your high-performing keywords you may find these:
Your brand name
Your own name
Keywords unique to your industry or services
What can you do with this knowledge? You can create more content that uses these keywords. You can also optimize your pages to bring in additional information about other products and services.
For example, if you run a housecleaning and janitorial business and your most popular keyword is “school cleaning services,” you can create a page focusing on this specific service that you offer. But to let customers know about other services, add a list of additional services at the bottom of this page, with links to those pages.
Use your keyword analytics to make your pages as useful as possible.
In addition to doubling down on keywords that are working, look for the keywords that aren’t showing up but that are important to you. Then, create blog content around those missing keywords. Over time, these keywords can yield results via organic searches.
When you see keywords with high impression counts but low click-through rates, work on optimizing the content further to show up higher on search results.
Specific Recommendations

We’ve gone over common terminology as well as what to look for from the data to optimize pages and experience growth.
Next in our guide to understanding your Squarespace analytics, we’ll go over some specific recommendations to follow depending on what type of website you run.
Ecommerce
Extremely useful data to check for ecommerce sites is sales by product. In particular, take a look at the data showing which products are being sold versus the number of views they are getting. Conversion rates of 7% to 11% are outstanding.
If you’re not seeing the conversion rates you want, there are things you can do to optimize each product page, such as:
Add more content to that product page
Reorganize the information present
Change the verbiage
Improve the copy
Add attractive images
Reduce image file sizes
You may think one product is bringing your customers the most value, but the Squarespace analytics data will show you what truly is providing the greatest value to your audience. Capitalize on this information to improve your other pages as well.
Review site content to learn more about how people are accessing your site and where they are going for information, then optimize those pages.
If you want to sell more of a particular product, add a blurb about it to the pages that are getting the most visits.
Bloggers
If you’re a blogger or content creator, you’ll find the site content analytics particularly valuable. This section lets you see what content people resonate with. Your job will be to make that info as easily accessible as possible for as much of your audience as you can.
Optimization ideas for bloggers include:
From your home page or another high-traffic page, link to old but popular blog posts so users can find them easily
Use site content to unearth valuable Squarespace SEO opportunities – which keywords are people searching?
Create more content using the more popular keywords
Also create new content for words you want to show up that aren’t showing up yet in searches
Consultants
If you’re a consultant or you offer specific services, you’ll also benefit from understanding your Squarespace analytics in the site content arena. You can gauge page performance by looking at the number of visitors to a page versus the time spent on that page versus the bounce rate.
If you have a service page with a high bounce rate AND a high number for time spent on that page, people may be filling out the form to get more info or schedule an appointment with you. If someone’s spending three minutes on one of your service pages, that page is likely working for you.
Review these important numbers:
Number of visitors to a page
Length of time spent on a page
Bounce rate of that page
There’s no specific formula to tie all these together, but you can garner valuable information from each category.
Another question you’ll want to explore is: How did the user enter and exit your website?
If you go to search keywords, you’ll be able to learn a great deal about which keywords are bringing visitors in, especially from organic searches.
If you go to site content, you’ll see which pages people land on the most, helping you figure out where they’re coming from.
Check the exit rate to see where people are leaving.
Finally, as a consultant you’ll want to make sure you’re blogging. This will increase your organic SEO over time and help you build a reputation with Google, showing that you’re an authority on a specific topic or service.
Portfolios
If you have a portfolio, be sure to study the Squarespace analytics under site content. Make whatever your top pages are easily accessible by ensuring they show up in your main navigation and are linked to and from other pages.
Drop the less important, less visited pages down to the footer menu.
Is a top page one of your projects? Be sure to add it prominently to your home page so that even more people can see it. Say you list six case studies, projects, or samples on your home page. Make sure the one page that people are visiting the most becomes the first item on your home page list.
Let the Data Work for You!
At the end of the day, understanding your Squarespace analytics enables you to make important decisions around content creation, website design, search engine optimization, marketing, ad campaigns, and more to capitalize on what people are searching for and bring you better results.
If you’re ready to learn more or you’d like personalized service, we at Spacebar Agency are here for you.
Check out our free guides for additional Squarespace SEO information you can use.
And be sure to subscribe to our monthly newsletter for useful tips to help your business grow.